The Oncoming Labor Storm
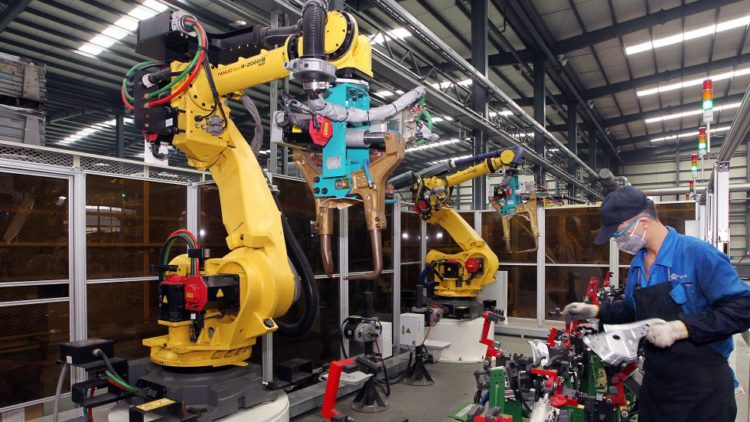
The rise of ‘right-wing’ politicians in post-industrial countries — politicians such as Donald Trump of the United States of America, Marie Le Pen of France, the late Jörg Haider and his successors in Austria, and others, and similar movements, such as the Tea Party movement in the U.S. — are only the beginning of what will probably be a 20 to 50 years of reactionary protests as major countries (indeed, all countries eventually) now transition from the Industrial Era into the Informational Era. The 2020’s will likely be a particularly tumultuous decade. The Informational Era denotes a period in human history when most economies are based upon performing services rather than manufacturing products. The U.S. have now entered that period and become ‘post-industrial’. Part of that transition has involved low-skilled manufacturing and industrial jobs (such as manufacturing thread or clothing, electronic devices, or simple furnitures and supplies) migrating to other countries where lower wages are paid. That part of the transition has been occuring during the past 40 to 50 years. However, another major and often overlooked part of this transition from Industrial to Informational involves robotics. For examples, very many manufacturing jobs in the U.S. have been replaced by robotics. An industrial robot controlled by someone who has a master’s degree in engineering can replace anywhere from several to a dozen or more manual laborers. These machines pay for themselves in only a few years. This revolution in robotic has transformed manufacturing in many countries. Hundreds of thousands, perhaps more than a million, industrial jobs in the U.S. have been lost due to robotics replacing workers, yet industrial manufacturing output in the U.S. has risen to record levels, exceeding output during the Industrial Era. Another reason why this new era is being called Informational is that technology has developed machines that can now use information (i.e, their programming) to create actual products in ways light years beyond what the simple Industrial Era mechanical loom could do. Moreover, that robotics revolution has begun to invade those countries were industrial jobs have migrated due to low wages. Earlier this year, the South China Morning Post of Hong Kong reported that one factory in China’s Jiangsu province used robots to replace 60,000 workers, and that 600 other companies in that province were drafting similar restructuring plans. In Taiwan, Foxconn, which manufacturers computer products for Apple, has spent a total of $500 million on robotics, […]


